Apple’s polished and carefully curated Benchmark Metrics are an illusion, designed to impress on paper but often disconnected from real-world performance. In other words, BS.
Apple lays out a glossy percentile system, letting you compare your app’s metrics to others in the same category. It shows if you’re brushing shoulders with top performers (the 75th percentile) or stuck somewhere near the bottom (the 25th percentile). On the surface, it sounds super handy, like a leaderboard in a video game. In reality, some reports can be misleading. Sure, it feels good when you see your app “performing as well as top apps,” until you realize some numbers can be skewed by ads, special promotions, and other wildcards that don’t reflect genuine traction.
I discovered that the hard way while tinkering on Smart Keys, an AI-powered keyboard I’ve been building to help people (especially myself) type faster and smarter. I was feeling way too proud of myself as I rearranged screenshots, polished keywords, and declared I’d cracked the code. The numbers insisted I was beating the top apps by a mile. Then I realized I was clinging to a metric that was all style, zero substance.
I obsessed over four data points, hoping my “genius” would unlock the secrets of the App Store. Here’s the quick breakdown, served with a side of humble pie.
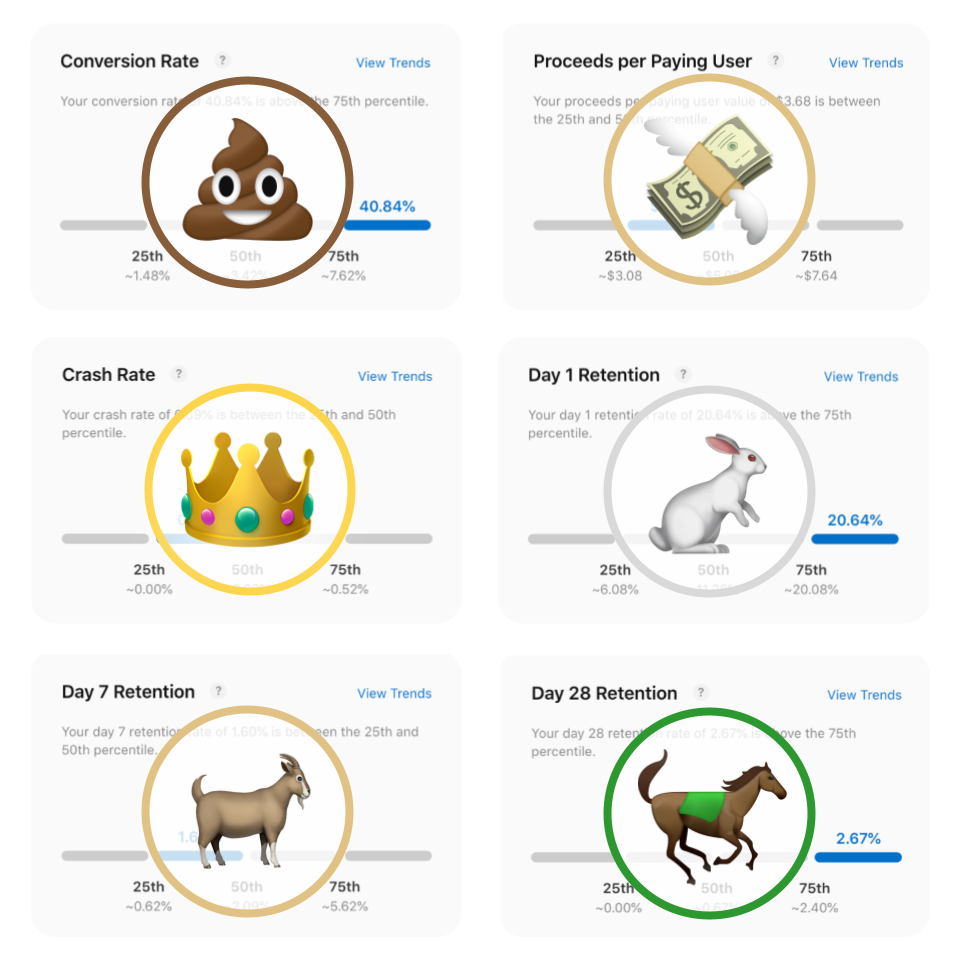
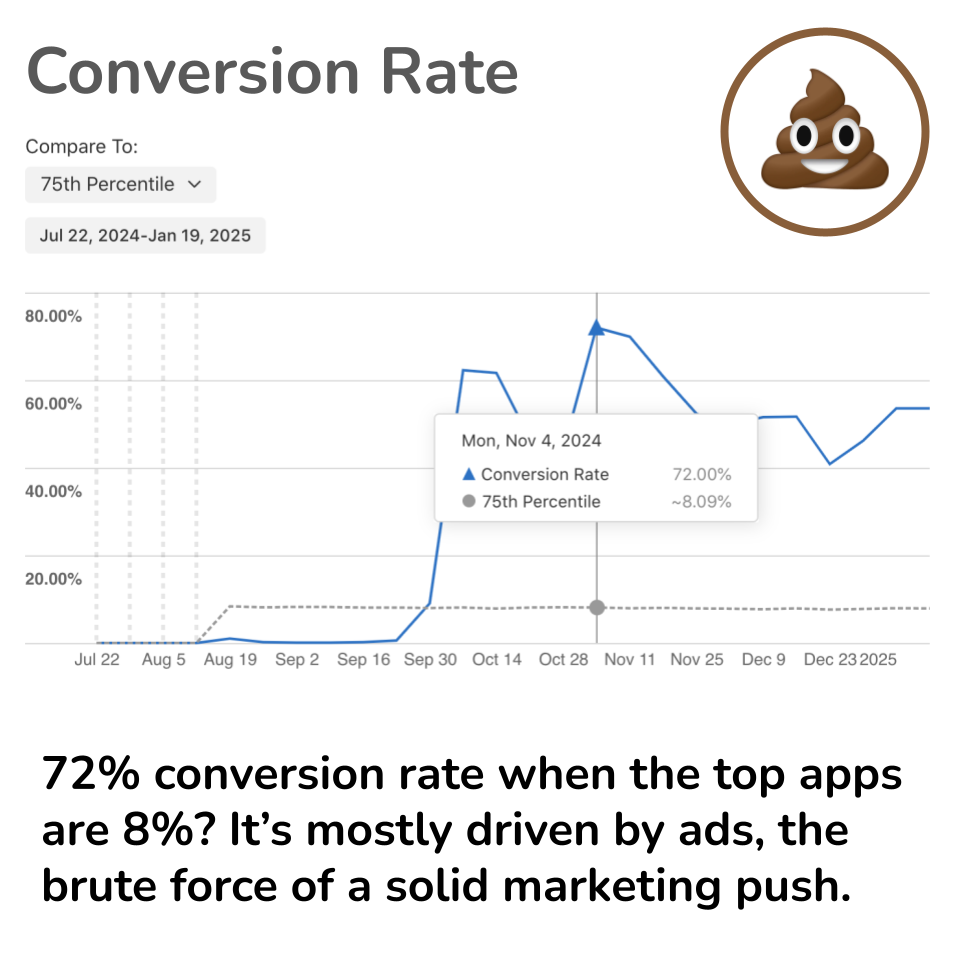
1. Store Conversion: The most BS of all
I treated this like my personal high score, proudly pointing at it like it was proof I had the Midas touch. Turns out it’s mostly driven by ads, the brute force of a solid marketing push, and unpredictable factors like being featured on popular blogs.
You can test every ASO tweak in the book, but nothing outdoes a well-funded campaign. That dose of reality bruised my ego, especially when I realized I’d been celebrating a metric that anyone with a decent ad budget could inflate.
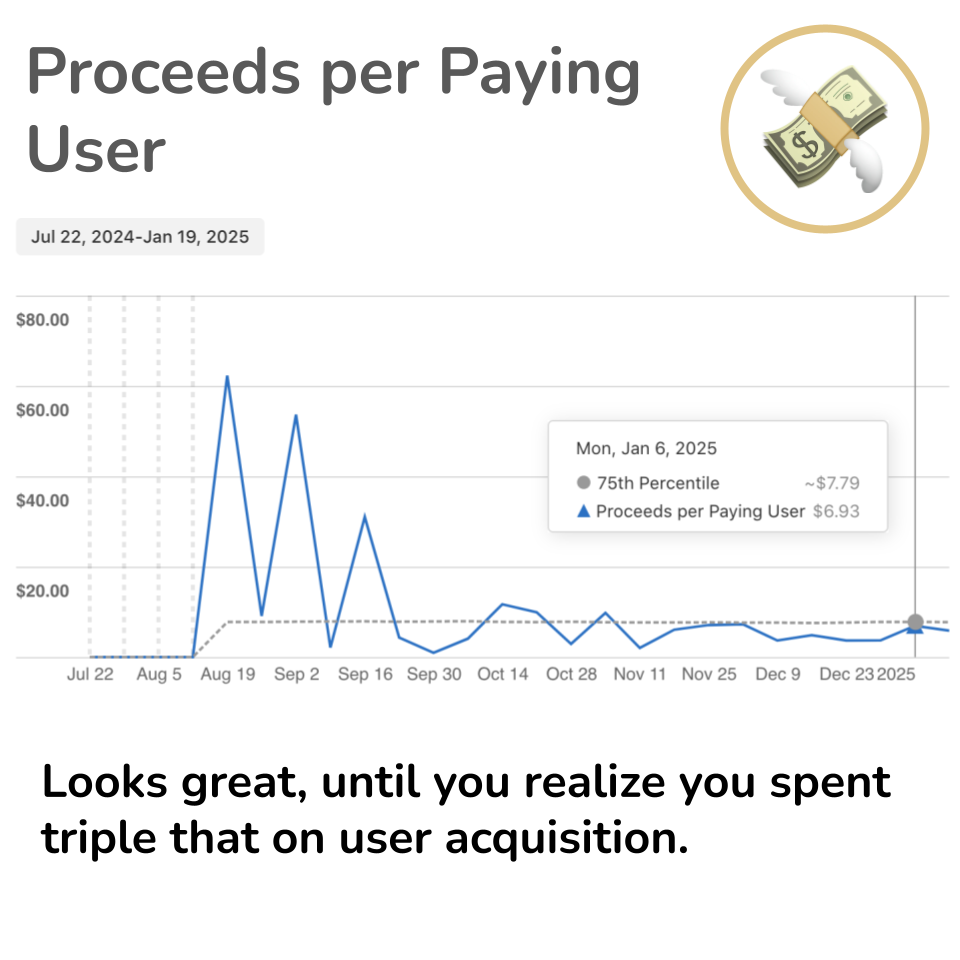
2. Proceeds per Paying User: Almost BS
This one fooled me for a while. It’s like checking your salary and forgetting about rent. Sure, “Proceeds per Paying User” looks impressive at a glance, but it hides the reality of how much you spent to acquire those users. If each paying user costs you three times what they bring in, you’re basically throwing money into a bonfire.
Nothing bursts your revenue bubble faster than realizing your lunch budget is leftover ramen packets because you blew all your cash on ads.
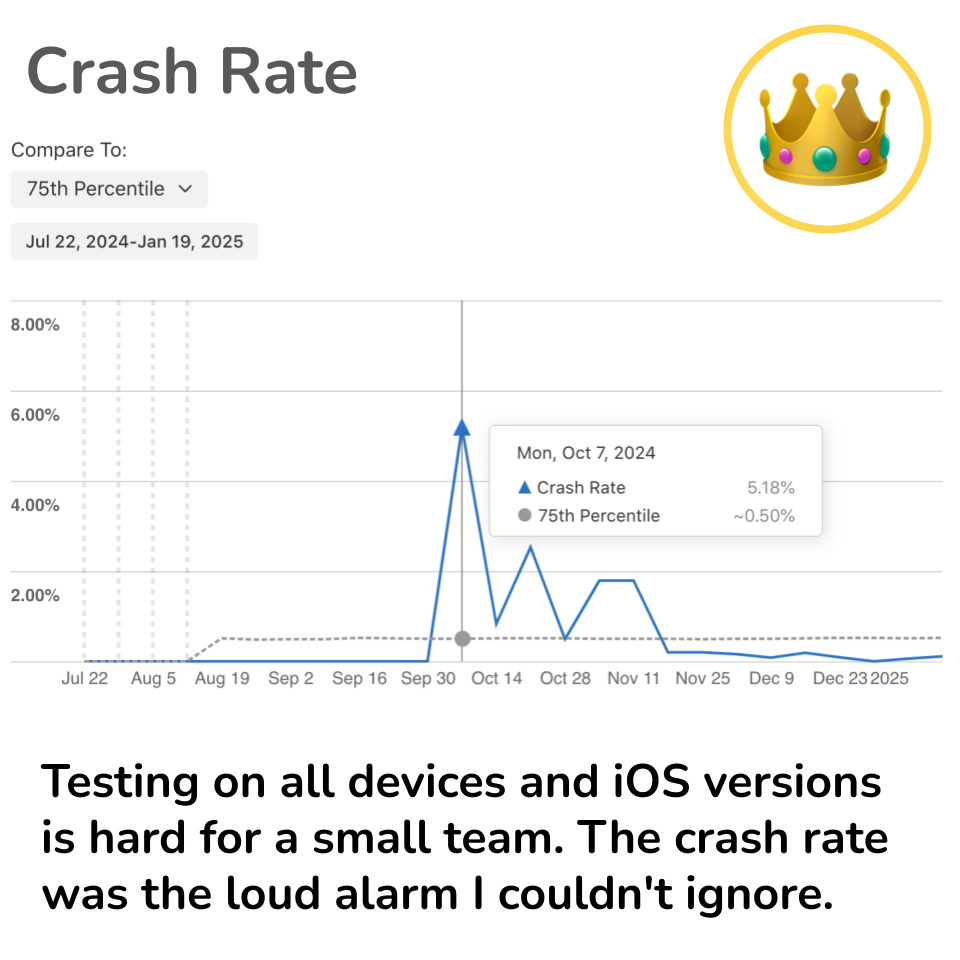
3. Crashes: Gold
This is where I got a much-needed wake-up call. Smart Keys had an onboarding crash bug that nearly drowned my starry-eyed dreams. On a small team, testing across all devices and iOS versions is no walk in the park, so the crash rate ended up being my loudest alarm. It let me catch the bug before a wave of 1-star reviews hit.
I’d rather stub my toe in the dark than face that. Crashes might not look sexy on a dashboard, but they show you if your app is on fire before everyone runs for the exits.
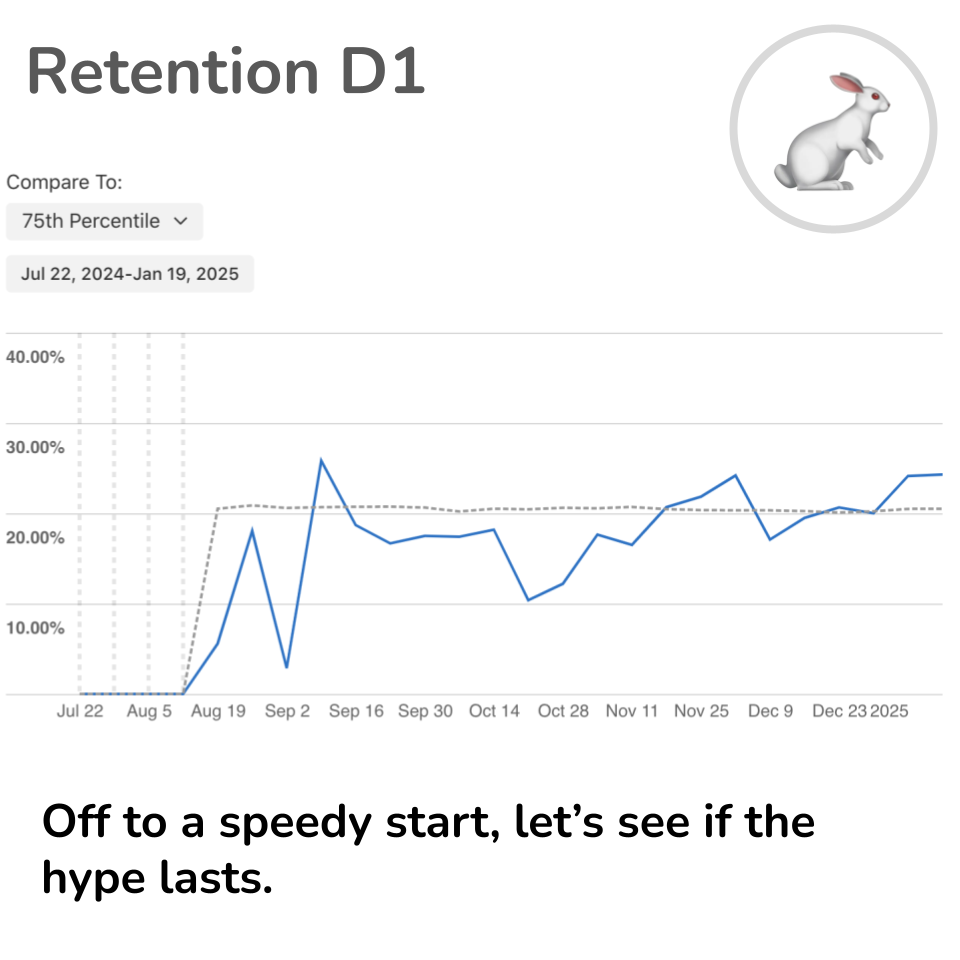
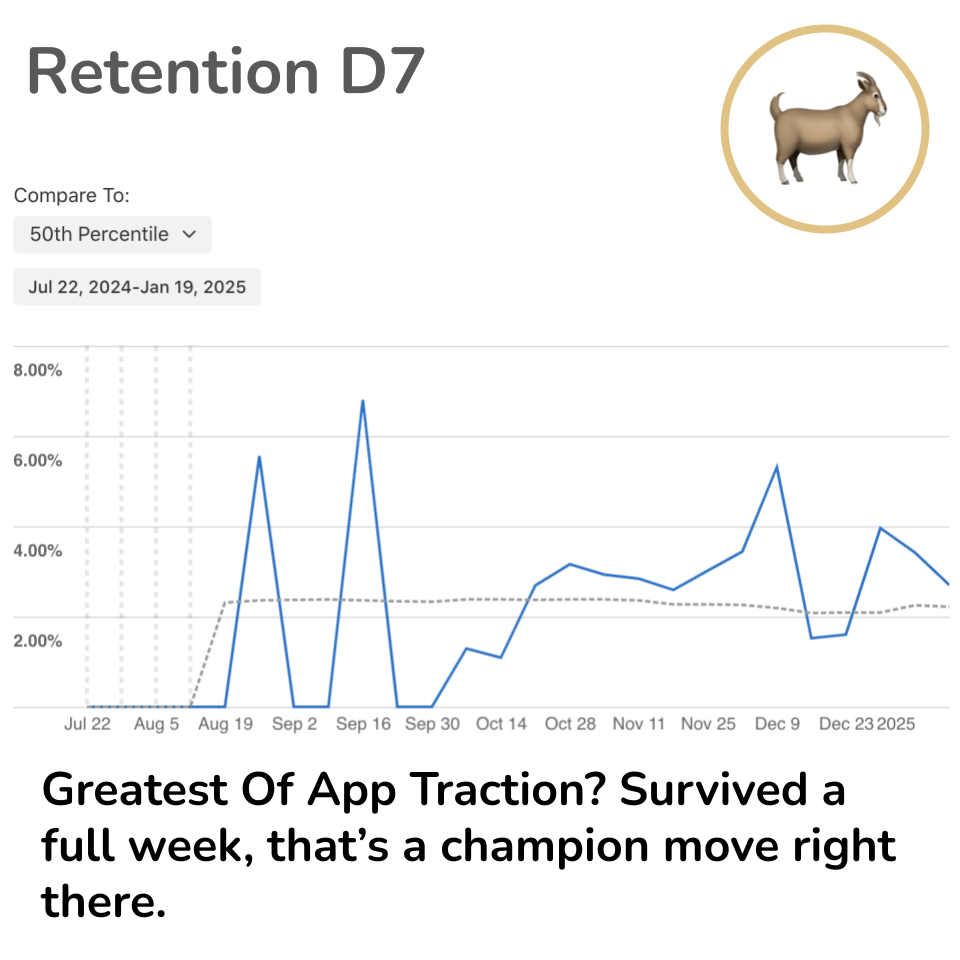
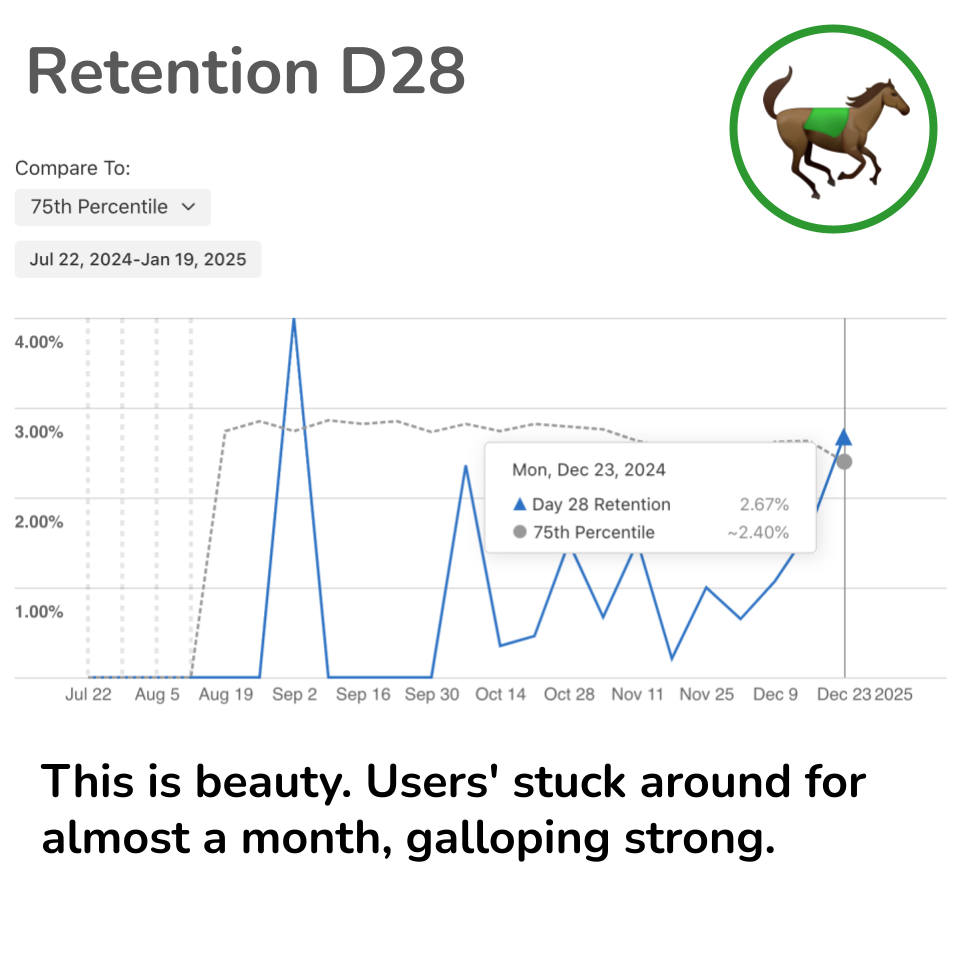
4. Retention (D1, D7, D28): Be patient
This one’s a slow burn that checks if people actually come back for more. Early on, I’d glance at the retention numbers and assume folks would stick around forever.
Then I got a reality check: trial periods, paywalls, or freemium strategies can skew these stats, and retention is a marathon, not a sprint. I’m still catching my breath, but at least I know if people keep showing up, I’m doing something right.
The truth is, these metrics can make you feel important, but they don’t tell the whole story. I’ve been learning more from watching the folks at Every and other brave souls building in public. They share real stories about triumphs and ugly mistakes, ASO magic tricks, and it’s oddly comforting to see the raw, unfiltered process.
I’m trying to do the same here with Smart Keys, focusing on real-world user feedback that directly shapes my updates and features. If you’re curious how all this no-BS talk translates into an actual product, give Smart Keys a try, or keep an eye on my #BuildingInPublic journey to see how it evolves.
Is any of these metrics relevant to you? Which metric should I dive into next?
Have a good week filled with no-BS insights.
(っ-,-)つ𐂃